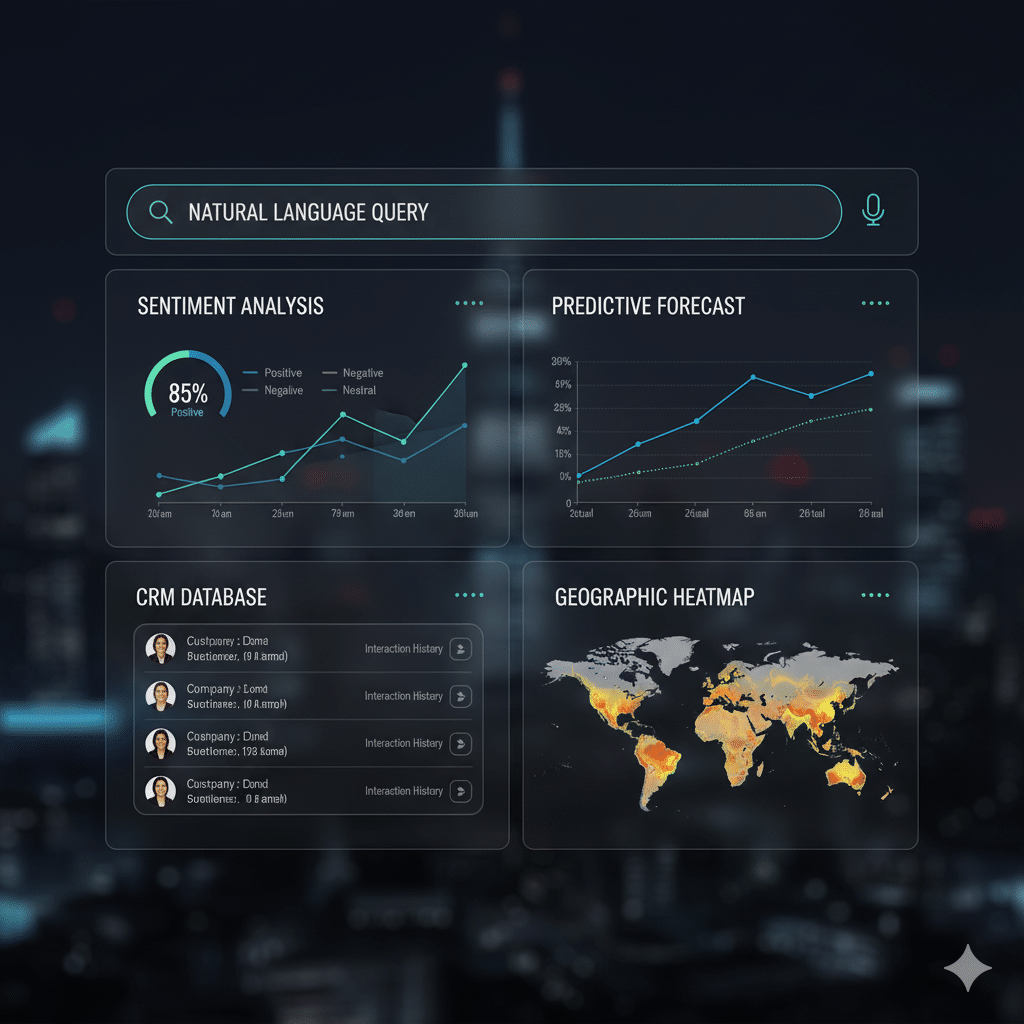
Maximize Insights with the LLM Analytics Dashboard for Your Data
Okay, so let’s just start with this data is messy. Like really messy. You’ve got numbers, text, logs, customer reviews, spreadsheets that nobody ever cleans up, and then leadership asking you to “make sense of it all”. Fun, right?
That’s where an LLM analytics dashboard actually saves your brain. Instead of staring at raw data forever, you throw it into a dashboard powered by large language models and suddenly you can talk to your data.
Ask questions in plain English (natural language queries), get insights, see patterns. It’s like having a data analyst sidekick that doesn’t sleep.
And honestly, the whole thing feels like magic sometimes… except it’s not magic, it’s just AI + data analytics playing really nice together.

Why an LLM Analytics Dashboard Matters
So here’s the deal: traditional dashboards are cool, but they kinda suck at unstructured data.
Customer reviews, call transcripts, social chatter all that text data usually gets ignored or squished into word clouds (which, let’s be real, nobody actually uses).
LLMs enable users to:

And the coolest part? You can literally ask, “Hey, show me sales trends for Q3 and tell me what customers were most annoyed about” and it spits out a chart plus contextually relevant text. That’s… huge.
Key Data Analysis Tasks an LLM Dashboard Handles
Alright, so what can these dashboards actually do? Here’s a messy list (because real life is messy):
So yeah, instead of juggling 5 tools Excel, Tableau, SQL, maybe some Python scripts you centralize it in one LLM analytics dashboard.
The Role of AI (and Why It’s Not Just Hype)

AI in analytics isn’t just about showing pretty charts. It’s about:
Side note: if you’ve ever tried explaining regression analysis to a manager, you know why natural language summaries are the real MVP here.
Features That Make an LLM Analytics Dashboard Useful
Let’s just bullet these out because that’s easier to scan:

Future Trends (Because This Stuff Is Moving Fast)
Like, where’s all this going? Here’s what I see happening:
Competitive Advantage with LLM Dashboards
Here’s the part your boss cares about: competitive edge.

So yeah, not to be dramatic, but an LLM analytics dashboard can shift your whole business strategy if you actually use it right.
FAQs
Q: Can an LLM dashboard replace data analysts?
Nope. It’s more like giving analysts superpowers so they don’t drown in repetitive tasks.
Q: Does it work with historical data and real-time?
Yep, most modern setups handle both. You can run long term analysis and also keep an eye on live metrics.
Q: What about accuracy can I trust the predictions?
Well… predictive analytics isn’t perfect. But LLMs definitely improve accuracy compared to old-school methods. Still, use human judgment.
Q: Are these dashboards customizable?
Yes, the good ones are. You can usually integrate data sources, tweak key metrics, and personalize visualizations.
Side Note
Don’t fall into the trap of thinking a shiny new AI dashboard = instant success. It’s still garbage-in, garbage-out.
If your raw data is messy, your insights will be too. Clean data = better insights.
Final Thoughts (Not Tidy, Just Honest)
So yeah, LLM analytics dashboards are basically the next step in data analytics.
They let you analyze large volumes of structured and unstructured data, provide valuable insights, and support data driven decisions in a way that feels natural like you’re chatting with your numbers instead of fighting them.
Will every business adopt it tomorrow? Probably not. But the ones that do will get a serious head start in strategic planning and competitive advantage.
My advice? Try one out. Don’t wait for the “perfect setup.” Start small, play around, ask messy questions, see what insights you get. That’s where the magic starts.
